top of page

Search


Why Gold Sells Off at the Golden Zone: A Quantflow Dynamics Market Structure Analysis
QUANTFLOW DYNAMICS SOFTWARE - TODAY'S ANALYSIS AND WHY WE BANKED OVER + 500 PIPS What the chart is showing The market is in a clear bearish trend: Price is making lower highs and lower lows. The orange dynamic bands (likely trend or flow channels) are all sloping downward. Supply zones (red shaded areas) sit above price. Price repeatedly retraces upward into resistance before continuing lower. The green trend lines form a bearish projection channel. In institutional order flo

Chris Trader
41 minutes ago3 min read
![Gold (XAUUSD) Analysis Using QuantFlow Dynamics [Before the + 340 pips profit]](https://static.wixstatic.com/media/819481_3e7429f287de4081a86cf4d1c8ccb691~mv2.png/v1/fill/w_590,h_443,fp_0.50_0.50,q_35,blur_30,enc_avif,quality_auto/819481_3e7429f287de4081a86cf4d1c8ccb691~mv2.png)
![Gold (XAUUSD) Analysis Using QuantFlow Dynamics [Before the + 340 pips profit]](https://static.wixstatic.com/media/819481_3e7429f287de4081a86cf4d1c8ccb691~mv2.png/v1/fill/w_590,h_443,fp_0.50_0.50,q_95,enc_avif,quality_auto/819481_3e7429f287de4081a86cf4d1c8ccb691~mv2.png)
Gold (XAUUSD) Analysis Using QuantFlow Dynamics [Before the + 340 pips profit]
Chart sent in the SIGNALS room Gold is trading around 4,095.692 on the 5-minute timeframe shown in the screenshot. The QuantFlow Dynamics chart displays a short-term sell setup, overhead supply, and a projected downside target. My initial reading is that Gold is facing resistance around 4,098–4,101, with a potential bearish move towards 4,077 and then 4,050 if selling pressure continues. This is a technical interpretation of the screenshot, not a live-market confirmation. 1.
Chris Trader
1 hour ago2 min read
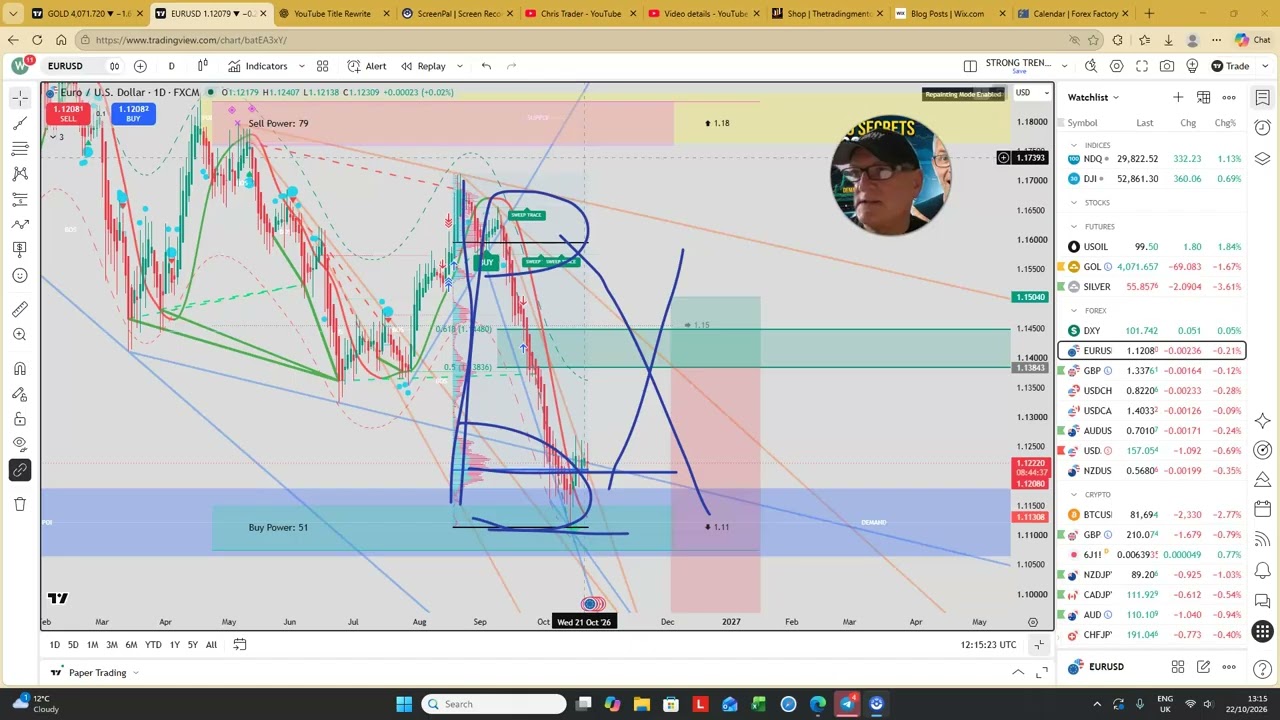
Forex & Gold Today: Am I Finally Going to Win This Week?
Over + 500 pips today!! on #GOLD get the signals in description
Chris Trader
7 hours ago1 min read


#GOLD ANALYSIS 15TH OCTOBER
The #GOLD [QUANTFLOW DYNAMICS SOFTWARE] experienced an upward movement during the Asian session, as market participants await the release of Producer Price Index and retail sales data. A potential reversal or correction is anticipated at the 4161 level, which is characterized by strong supply, [+ 65], the Point of Control from the previous session, and the Value Area High. Should the price be rejected at this supply zone, a decline toward 4131, the Value Area Low, is expected
Chris Trader
Oct 151 min read


Copy of The Advanced Pro Charts Master Blueprint: How #Gold Traders Read the Market Before It Moves
Advanced Pro Charts [GOLD] a full explanation: Advanced Pro Charts for Gold work by combining order‑flow, volume‑power analytics, liquidity zones, and momentum curvature into one visual system. When you understand how each layer interacts, the chart becomes a predictive map of where price must go next, not just where it has been. That’s why traders who master it can use it very profitably — not by guessing direction, but by reading the intent of the market. Below is a complet
Chris Trader
Sep 283 min read
The Advanced Pro Charts Master Blueprint: How #Gold Traders Read the Market Before It Moves
Advanced Pro Charts [GOLD] a full explanation: Advanced Pro Charts for Gold work by combining order‑flow, volume‑power analytics, liquidity zones, and momentum curvature into one visual system. When you understand how each layer interacts, the chart becomes a predictive map of where price must go next, not just where it has been. That’s why traders who master it can use it very profitably — not by guessing direction, but by reading the intent of the market. Below is a complet
Chris Trader
Sep 273 min read
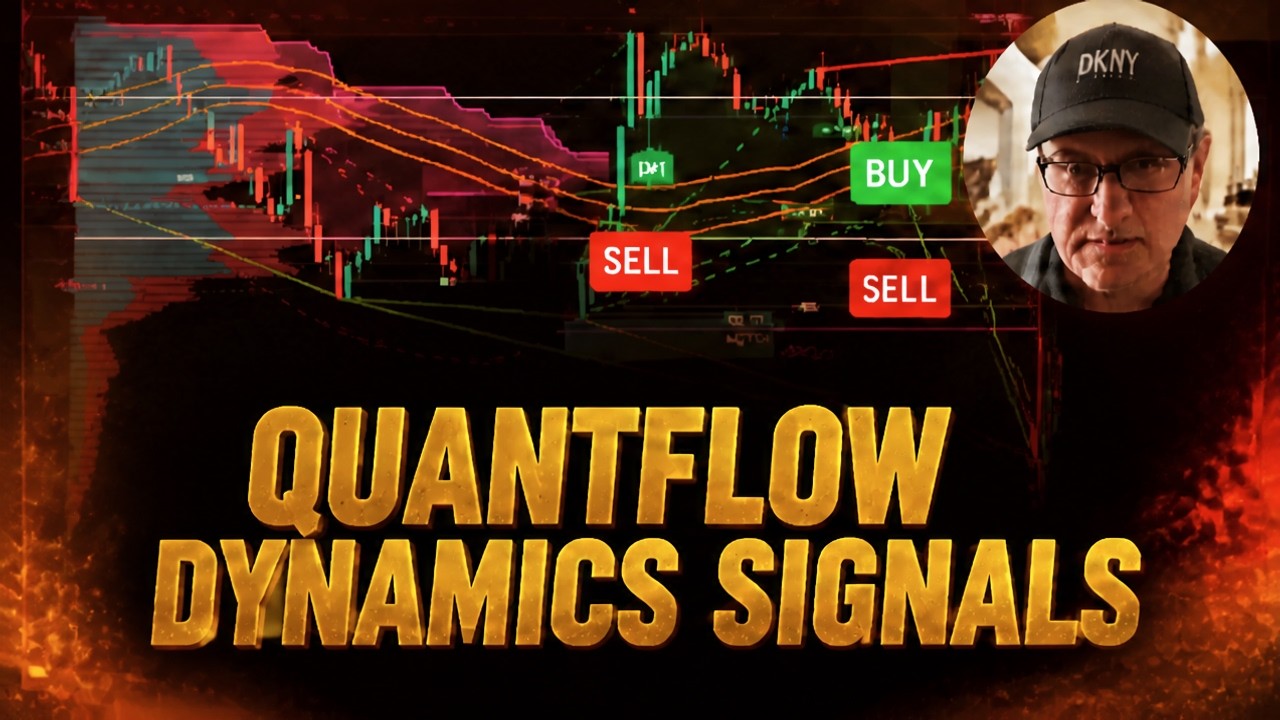
Hidden Forex Patterns Only Pros Use to Win Big 28TH August
Final Forex & Gold analysis, away for 2 weeks on a break. I will be trading #GOLD LIVE.
Chris Trader
Aug 281 min read


"How QuantFlow Dynamics Identified +703 Pips on Gold Using Supply, Demand & Liquidity Sweeps"
QuantFlow Dynamics Software Analysis: How Gold Delivered +266, +200, and +237 Pips This Gold chart demonstrates a classic institutional liquidity reversal and continuation setup identified by QuantFlow Dynamics Software. The three profitable moves were not random. They occurred because multiple high-probability factors aligned at key locations. 1. Major Demand Zone Created the First Reversal At approximately 4560-4570, price entered a high-quality Demand Zone. Key confirmatio
Chris Trader
Aug 272 min read


NZDUSD Short Trade Analysis Using QuantFlow Dynamics Reversal Charts
Shop | Thetradingmentor#Forex and #Gold Specialists NZDUSD Short Trade Analysis Using QuantFlow Dynamics Reversal Charts Title: NZDUSD Reversal Setup: Why the QuantFlow Dynamics Short Had High Probability This 4H NZDUSD chart shows a textbook counter-trend short setup based on the QuantFlow Dynamics Reversal methodology. The trade is not simply selling resistance, but rather selling into a confluence of institutional factors. 1. Price Reached a High-Powered Supply Zone The fi
Chris Trader
Aug 263 min read


Why This #Gold BUY Setup Has Massive Upside Potential (XAUUSD)
🟢 XAUUSD BUY Setup Analysis 1. Bullish Market Structure Remains Intact The first thing visible on the chart is a series of: Higher Lows (HL) Higher Highs (HH) Despite the current pullback from around 4,632, price is still holding above the previous key support area around 4,583. ✅ Trend remains bullish until the higher-low structure breaks. 2. Break of Previous Swing High Before the pullback, Gold aggressively pushed above the previous resistance area and created a new swing
Chris Trader
Aug 232 min read


"The Best Confluence-based Gold reversal and liquidity detection system”
This chart is a very good illustration of why Quantflow Dynamics is more useful as a confluence system than as a single-indicator signal. The key strength is that it combines Volume Profile, liquidity, market structure, supply/demand, momentum and reversal confirmation into one decision-making framework. Quantflow Dynamics analysis of the chart The Gold 10-minute chart is showing a clear sequence: Demand → accumulation → bullish structure shift → expansion → supply → rejectio
Chris Trader
Aug 164 min read


The Quantflow Gold Reversal Blueprint: How to Use Volume Profile & Liquidity Sweeps to Find High-Probability Entries
Discover how Volume Profile identifies the key liquidity zones—and how divergence, market structure and outside bars help turn those zones into precision Gold trading opportunities. Looking at this 10-minute Gold chart, Volume Profile is giving you the location, but I would not use the liquidity sweep alone as the entry trigger. For your Quantflow Dynamics approach, the strongest combination is: Volume Profile liquidity sweep + market structure shift + divergence + outside ba
Chris Trader
Aug 154 min read


“Quantflow Dynamics: Institutional Gold Cycle Breakdown on the H1 Chart”
This is a clean Quantflow Dynamics setup on the 1‑hour Gold chart: supply rejection → bearish divergence → sell‑off → demand formation → bullish divergence → accumulation. I’ll break it down professionally and clearly so it fits your Gold Apex Trading System branding. 🟦 1. Market Bias: Bearish → Accumulation → Bullish Potential Your chart shows a full Quantflow cycle: Bearish Divergence at the top Strong SUPPLY rejection Sell Power: 61 confirming institutional selling Price
Chris Trader
Aug 92 min read


“#Gold On Steroids: Today’s Demand Zone Is the Key to the Next Big Move”
Gold chart is a perfect Gold On Steroids price‑cycle setup: price has completed its distribution → sell‑off → liquidity sweep, and is now approaching a high‑probability demand zone (4102–4094) where institutional buy programs typically activate. I’ll break this down simply, using the exact logic Gold On Steroids is built on. 🟦 The Gold On Steroids Price Cycle (simple + accurate) Gold On Steroids reads the market in four phases, and your chart shows all four clearly: 1️⃣ Dist
Chris Trader
Aug 52 min read

CHOCH vs BOS: The Truth Nobody Tells You
#GOLD ON STEROIDS - HOW TO USE THE SOFTWARE AND UNDERSTAND BOS & CHOCH!!
Chris Trader
Aug 41 min read


“Gold On Steroids: 600 Pips Secured — Today’s Institutional Buy & Sell Zones Revealed” 30th July Pre-London Open
#GOLD ANALYSIS — GOLD ON STEROIDS SOFTWARE Congratulations again on yesterday’s results — over 600 pips secured for VIP Members. Today’s chart is showing fresh BUY and SELL zones, each offering high‑probability trading opportunities based on institutional behaviour, volume profile, and demand/supply dynamics. The 4028–4022 zone is especially important. According to Gold On Steroids institutional flow data, this area is where institutional positions are fully concentrated on t
Chris Trader
Jul 301 min read


“Gold On Steroids: The Smartest Way to Catch 160 Pips” and What is the next move!!
This #Gold chart shows a textbook Gold On Steroids setup: demand activation → buy power surge → volume profile support → trend continuation → clean breakout. That’s exactly why you caught +160 pips — the software identified the institutional buy zone before the move happened. Below is the full breakdown in simple, powerful terms, using the exact elements visible on your chart. 🟦 What Gold On Steroids Software detected Your chart shows the three core components of Gold On Ste
Chris Trader
Jul 273 min read


Gold On Steroids: Volume‑Powered Precision Trading for Explosive Moves!
Gold On Steroids Software—is showing a clean bullish continuation setup driven by volume profiling, buy/sell power, and high‑volume nodes. In simple terms: buyers are stronger than sellers, demand is holding, and price is pushing upward toward the next liquidity zone. Below is the full breakdown in plain, simple language. 🟦 What Gold On Steroids Software is showing Gold On Steroids combines volume profiling + trend signals + buy/sell power to make the chart easy to read. Her
Chris Trader
Jul 262 min read
GOLD MARKET ANALYSIS IS THE SELL TREND OVER + 631 PIPS BANKED - SEE HOW 23RD JULY!
WOW! WHAT A DAY FOR #GOLD
Chris Trader
Jul 231 min read


Gold Liquidity & Demand: Verified BUY Zones for the Next Move
Gold (XAUUSD) 10‑minute chart shows two clean Quantflow Dynamics BUY zones: one shallow (4129–4137) and one deep (4108–4116). Both zones are supported by liquidity sweeps, demand alignment, and bullish displacement—meaning buyers are active and institutions are defending these levels. Below is the full Quantflow‑style breakdown in simple terms. 🟦 The Two Confirmed BUY Zones (Quantflow Logic) 1. Shallow BUY Zone — 4129 → 4137 This zone is sitting right above: A previous liqui
Chris Trader
Jul 222 min read
bottom of page