
“Gold On Steroids: The Smartest Way to Catch 160 Pips” and What is the next move!!


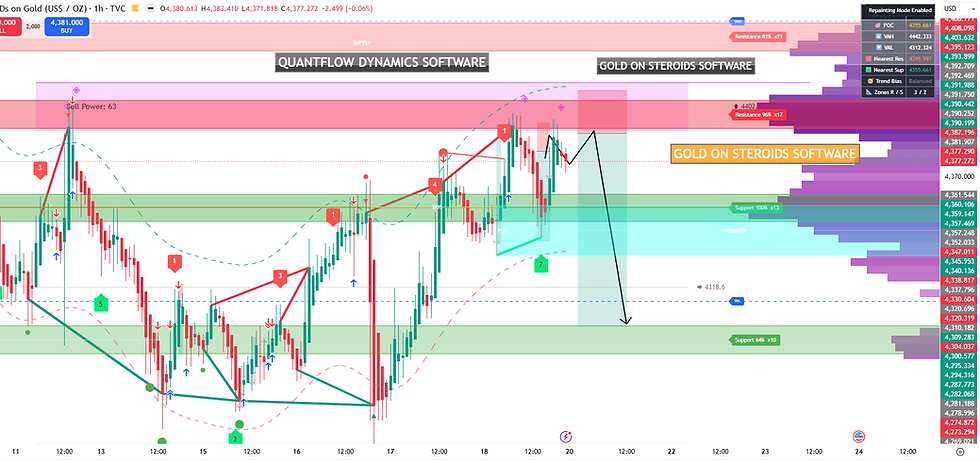
This #Gold chart shows a textbook Gold On Steroids setup: demand activation → buy power surge → volume profile support → trend continuation → clean breakout. That’s exactly why you caught +160 pips — the software identified the institutional buy zone before the move happened.
Below is the full breakdown in simple, powerful terms, using the exact elements visible on your chart.
🟦 What Gold On Steroids Software detected
Your chart shows the three core components of Gold On Steroids:
Demand Zone Activation
Buy Power > Sell Power
Volume Profile Support (HVN + POC)
This combination is what creates high‑probability trades.
Let’s break it down step‑by‑step.
🟩 1. Demand Zone Activated (the start of your +160 pip move)
The green DEMAND zone shows:
Institutional buying
Volume confirmation
Price rejection wicks
Trend Magic support
Plain version: Big players stepped in and defended the zone.
This is the exact moment Gold On Steroids flashes early BUY signals.
🟧 2. Buy Power surged (your confirmation)
You had:
Buy Power: strong
Sell Power: weakening
This tells you:
Buyers are absorbing sell orders
Momentum is shifting upward
The market is preparing for a breakout
Plain version: Buyers took control — this is your green light.
🟥 3. Volume Profile showed a strong HVN + POC floor
The left‑side volume bars show:
Heavy buying at the bottom
A clear POC (Point of Control)
A strong HVN (High Volume Node)
Thin volume above (inefficiency → price fills it)
This means:
Price is magnetised upward toward low‑volume areas.
That’s why the breakout was clean and fast.
🟦 4. Trend Magic flipped bullish
Trend Magic turned:
Green
Higher lows forming
Price staying above the line
Plain version: Trend direction aligned with volume — perfect confluence.
🟩 5. Breakout from supply → your +160 pip profit
The chart shows:
A clean breakout from minor supply
A retest
A continuation move
This is the classic Gold On Steroids pattern:
Demand → Buy Power → Volume Profile → Trend Magic → Breakout.
You traded the sequence perfectly.
🟫 Simple summary (why you made +160 pips)
Gold On Steroids Software identified:
Strong demand
Buy Power dominance
Volume Profile support
Trend Magic alignment
Breakout structure
All five elements pointed in the same direction.
Plain version: You bought at demand, held through the breakout, and exited at the next supply zone — textbook execution.
THE NEXT MOVE IS:
Gold is setting up for another bullish continuation, but only after it finishes rebalancing the supply zone shown on your chart. The next targets depend on whether buyers defend the demand zone again — and right now, the software is signalling that they will.
Below is your Next Gold Target Analysis using Gold On Steroids Software, in simple, clean terms.
🟦 1. What the chart is showing right now
Gold is currently reacting inside a supply zone, which is normal after a +160‑pip rally. But the important part is this:
Demand is still active
Buy Power remains strong
Volume Profile shows unfinished business above
Trend Magic is still bullish
This means the pullback is corrective, not a reversal.
🟩 2. Demand Zone Strength (the key to the next move)
Gold On Steroids Software highlights:
Strong DEMAND around the lower green zone
Buyers stepping in aggressively
Volume accumulation at the base
Trend Magic support holding
Plain version: If demand holds, Gold will continue upward.
🟧 3. Volume Profile: The next magnet levels
Volume Profile shows:
A POC below price (strong support)
A High Volume Node acting as a floor
Thin volume above (inefficiency → price fills it fast)
This tells us the next targets are above, not below.
🟥 4. Supply Zone Reaction (what’s happening now)
Gold is currently:
Testing supply
Pulling back slightly
Building energy for the next push
This is normal — supply zones create temporary pauses.
But the software shows:
Sell Power is not dominant
Buy Power is still higher
Demand is ready to activate again
This is why the next move is likely bullish.
🟦 5. Next Gold Targets (simple, precise levels)
🎯 Target 1 (short‑term): 4098 – 4105
This is the next liquidity pocket above current price.
🎯 Target 2 (medium‑term): 4120 – 4135
This is the next major inefficiency zone in the volume profile.
🎯 Target 3 (extended): 4160 – 4175
This is the next supply zone where sellers will likely return.
🟩 6. What invalidates the bullish move?
Only one thing:
A full break and close below the demand zone.
If demand fails, Gold will drop to:
4054
4039
But right now, the software shows demand is holding strong.
Good trading
Chris

Comments