
#GOLD profits over 500 pips! But has Bearish Market Trends with Potential Short-Term Rebound
- Chris Trader

- Jun 10
- 2 min read
Overall Market Structure
Primary trend remains bearish.
Price has been making a sequence of lower highs and lower lows inside a descending channel.
Multiple moving averages/ribbons are stacked bearishly and sloping downward.
The recent green candle is a counter-trend bounce, not yet a confirmed trend reversal.
What Happened Recently
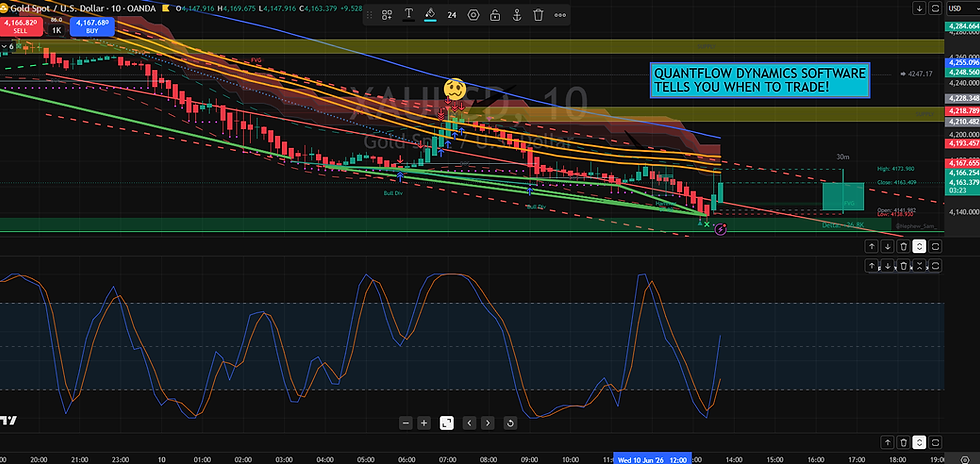
Gold sold off aggressively into the green demand/support zone around 4,135–4,145.
Several bullish divergence markers ("Bull Div") appear on the chart, suggesting:
Momentum was weakening while price was still making lower lows.
Sellers may be becoming exhausted.
The stochastic oscillator at the bottom has turned sharply upward from oversold territory, supporting a short-term rebound.
Key Resistance Levels
Looking at the right side of the chart:
4,166–4,170
Current resistance and first test area.
Price is trading around this level now.
4,180–4,190
Confluence of moving averages and channel resistance.
Stronger barrier.
4,218–4,248
Major supply zone (highlighted yellow).
A rally into this area would likely attract sellers unless momentum becomes very strong.
Key Support Levels
4,140–4,145
Immediate support.
Recent reaction low.
4,130 area
Lower channel support.
If broken, bears regain full control.
Trade Bias
Bullish Scenario (Higher Probability Short-Term)
The chart appears to be attempting a relief rally.
For bulls:
Hold above 4,145.
Break and close above 4,170.
Target:
4,180–4,190 first.
Then 4,205–4,220.
The green projection box on your chart suggests a move toward roughly 4,174.
Bearish Scenario (Higher Probability Medium-Term)
The dominant trend is still down.
Watch for:
Rejection at 4,170–4,190.
Bearish candles near channel resistance.
Momentum oscillator rolling over before reaching overbought.
If that happens:
Price could retest 4,145.
Then potentially make new session lows.
What I'd Need to See for a Trend Reversal
A true bullish reversal would require:
Break above the descending channel.
Close above the EMA/ribbon cluster.
Higher high above the recent swing near 4,220.
Retest holding as support.
None of those conditions have occurred yet.
Current Read
Short-term: Bullish rebound underway.
Intraday: Neutral-to-bullish while above 4,145.
Higher timeframe structure: Still bearish until 4,190–4,220 is reclaimed.
The highest-probability interpretation right now is a relief rally inside a larger downtrend, rather than the start of a new bullish trend.
Improve accuracy for strategy and analysis
Upgrade to QUANTFLOW DYNAMICS SOFTWARE and use the latest Thinking model to develop strategy, with great execution and highly profitable strategies.
Chris
Trader for over 35 years, why would I use anything else!


Comments