
#XAUUSD Analyzing Bullish Market Signals and Key Resistance Levels
- Chris Trader

- Jul 19
- 2 min read
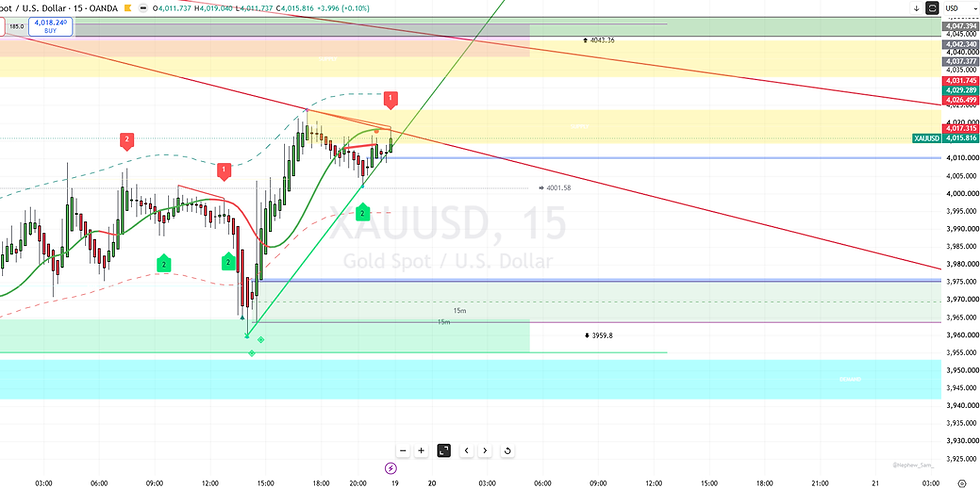
1. Bullish market structure
Price has made a strong impulsive move from around 3958.
The pullback has formed higher lows, which is healthy.
Buyers have defended the rising trendline several times.
2. Bull flag / triangle
The recent candles are compressing beneath a descending resistance line.
This resembles a bull flag or descending triangle breakout attempt.
The latest candle is pushing into that resistance, suggesting buyers are testing it.
3. Dynamic support
Price is sitting above the fast moving average (green MA), which has started turning upward.
That often supports continuation if buyers maintain momentum.
4. Supply overhead The chart clearly marks a supply zone around:
4017–4025
Higher supply around 4035–4045
These are likely to attract sellers.
Bullish scenario (higher probability)
If price closes convincingly above the descending trendline and 4017-4020, I'd expect:
Target 1
4025
Target 2
4035
Target 3
4043–4045 (major supply)
This would also confirm the flag breakout.
Bearish scenario
If buyers fail here:
rejection from 4017–4020
bearish engulfing candle
break below the rising trendline
Then I'd expect a retracement toward
4008
4001
3975 (major support on your chart)
A move below 3975 would invalidate the current higher-low structure and shift momentum back to sellers.
Key levels
Resistance | Importance |
4017 | Immediate breakout level |
4025 | Minor resistance |
4035-4045 | Strong supply |
4045+ | Bullish continuation |
Support | Importance |
4010 | Intraday support |
4001 | Structure support |
3975 | Major demand |
3958 | Swing low |
Probability estimate
Based only on this chart:
🟢 Bullish continuation: 65%
🔴 Pullback to 4001 first: 35%
The reason is:
higher lows remain intact,
momentum is improving,
price is pressing against resistance instead of being rejected sharply.
What I'd watch next
The next 2–4 candles are critical.
Strong bullish close above the descending trendline → expect a run into 4025, then 4035–4045.
Long upper wick or bearish engulfing at current resistance → likely retracement toward 4008–4001 before another attempt higher.
Overall, this chart still favours the bulls unless price loses 4001 and especially 3975.
Questions?
Chris


Comments