
Understanding #GOLD Reversal Charts and Key Indicators to Watch
- Chris Trader

- 17 hours ago
- 1 min read
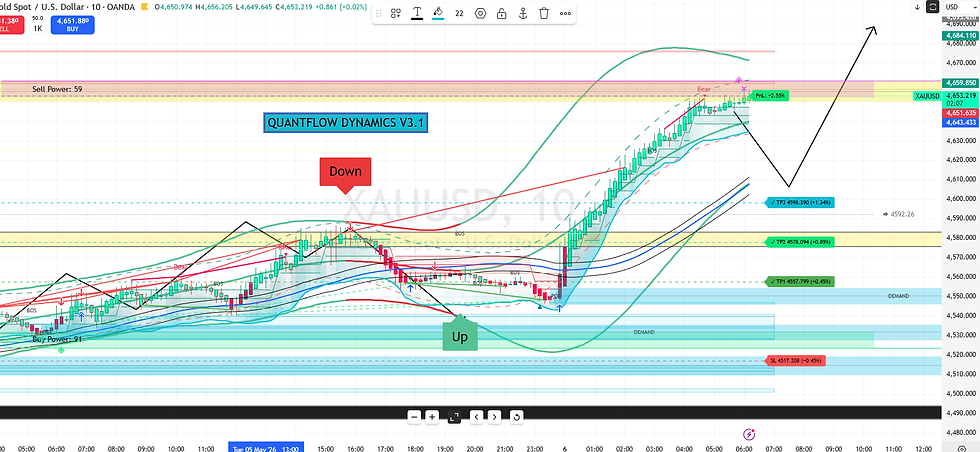
![GOLD SELL 4580_4585 [sent at 15.53pm]](https://static.wixstatic.com/media/819481_a892f6ef665b4256a6fb98052bf6d8e3~mv2.png/v1/fill/w_980,h_561,al_c,q_90,usm_0.66_1.00_0.01,enc_avif,quality_auto/819481_a892f6ef665b4256a6fb98052bf6d8e3~mv2.png)
TP ¹ : 4575
TP ² : 4570
TP ³ : 4565
TP ⁴ : 4560
TP ⁵ : 4555
SL ❌ 4595
Reversal
Identifying High Probability Reversal Trades Using Key Indicators
The chart above illustrates a combination of events that suggest a high-probability trade for a reversal.
Initially, the POWER signal exceeding 73, combined with a reading above 60, strongly indicates a likelihood of a price decline. This probability is further enhanced by the presence of the supply zone highlighted in yellow.
Finally, we seek negative divergence, marked in red, to complete the setup.
A significant profit achieved despite other markets remaining stagnant.
Chris

Comments