
🚨 Gold on Steroids Signals Major Sell-Off Ahead | XAUUSD Analysis

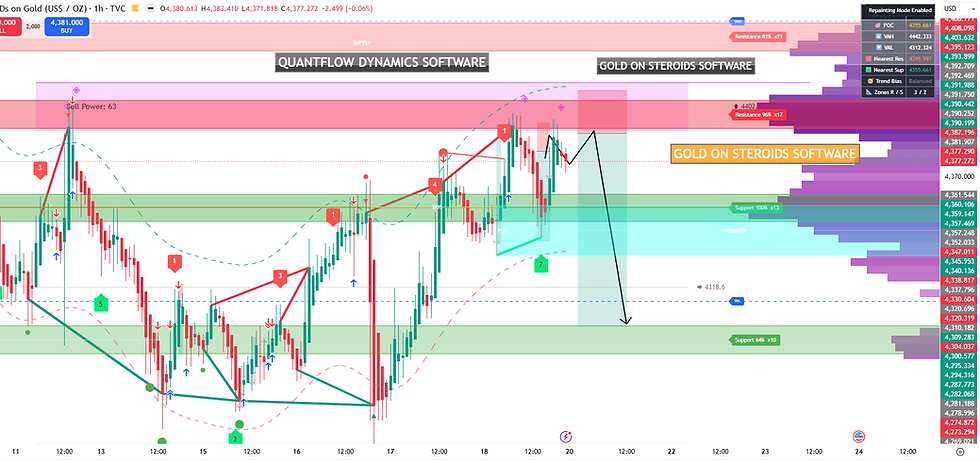
Timeframe: Gold (XAU/USD), 1-hour chart.
Key Levels Visible
Major resistance/supply zone: 4390 - 4402
Current price area: 4377
Demand/support zone: 4357 - 4361
Lower support: 4304 - 4310
POC (Point of Control): around 4355
Nearest resistance shown by the software: approximately 4399
Trend Bias panel: Balanced
Market Structure
Strong bullish impulse from 4280s into 4390s
Price has recently rallied aggressively.
Higher highs and higher lows are intact.
Price is currently under a major supply zone
Several candles have rejected around 4390-4400.
Wicks indicate sellers defending that area.
Volume profile
Heavy volume sits lower around 4355-4360.
Markets often revisit high-volume nodes before choosing the next directional move.
Software projection
The black path drawn on the chart suggests:
A minor bounce upward first.
Failure below resistance.
Then a larger move down toward 4310-4320.
Most Likely Scenario (Based on Current Chart)
Bearish retracement first (60-65% probability)
Expected path:
Retest 4385-4395
Rejection from supply
Drop into 4360
If 4360 breaks, continuation toward:
4330
4310
potentially 4304 support
This aligns with the projected path drawn on the chart and the visible supply overhead.
Bullish Alternative
If buyers achieve an hourly close above 4402, the bearish idea becomes weaker.
Targets above:
4420
4432
4442 (VAH area shown on the profile)
A clean breakout above the supply zone would suggest the market is still in trend continuation mode.
Trading Bias Right Now
Short-term: Bearish retracement.
Medium-term: Neutral to bullish while above 4304.
Confirmation I'd want for a sell:
Rejection candle around 4388-4400
Lower high on the 15m/1h chart
Breakdown below 4360
Probability View
Scenario | Probability |
Pullback to 4360 then bounce | 35% |
Pullback to 4310-4330 | 40% |
Immediate breakout above 4402 | 25% |
So from this screenshot alone, the highest-probability next move appears to be one more test towards 4385-4395 followed by a decline into 4360, with risk of extension to 4310-4330 if demand fails. Chris WWW.THETRADINGMENTORS.COM/SHOP

Comments