
Exploring Quantumflow Dynamics in Action and Its Significance
- Chris Trader

- Jan 12
- 1 min read

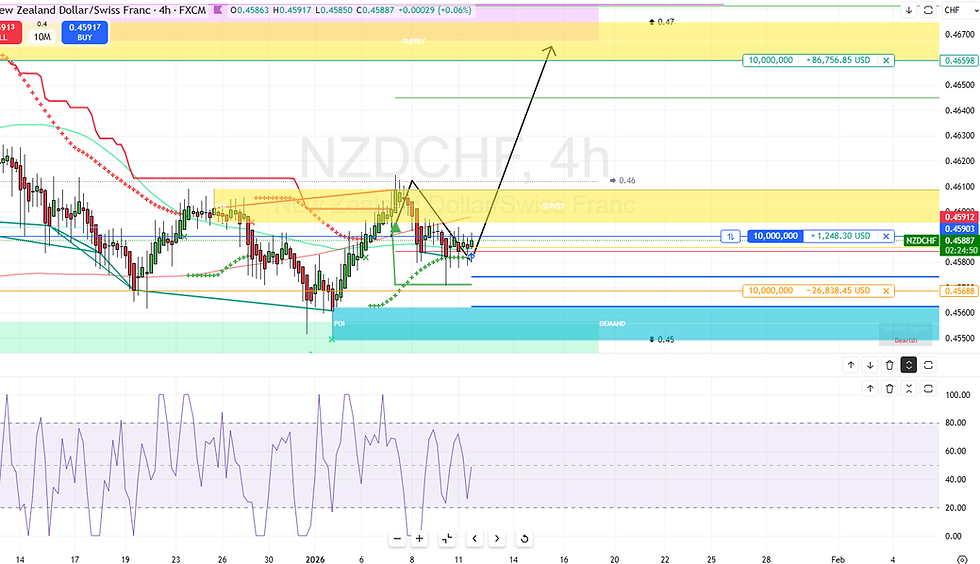
In the above #GBPJPY example, we can clearly see the BUY direction as it moves into the demand zone on the 4-hour chart. This movement is particularly significant as it indicates a strong potential for price appreciation in the near future. The demand zone represents a price level where buying interest is strong enough to overcome selling pressure, suggesting that many traders and investors are likely looking to enter long positions at this point. This is further reinforced by the recent pullback in Money Flow, which has now reached oversold conditions. When the Money Flow indicator dips into the oversold territory, it typically signals that the asset has been sold off excessively, creating a situation where a rebound or a bounce is not only possible but also highly likely. The convergence of these technical signals—the approach to the demand zone coupled with the oversold Money Flow—creates a compelling case for anticipating a bullish reversal. Traders often look for confirmation through additional indicators or candlestick patterns to validate their entry points, which can enhance the effectiveness of their trading strategy. Therefore, the current setup in the GBPJPY pair presents a noteworthy opportunity for traders who are keen on capitalizing on potential upward movements in the currency pair. BUY SOFTWARE HERE
Other examples are:


Comments