
Copy of What to Expect in the Forex Market This Week June 22 Gold Price Insights
- Chris Trader

- Jun 21
- 3 min read
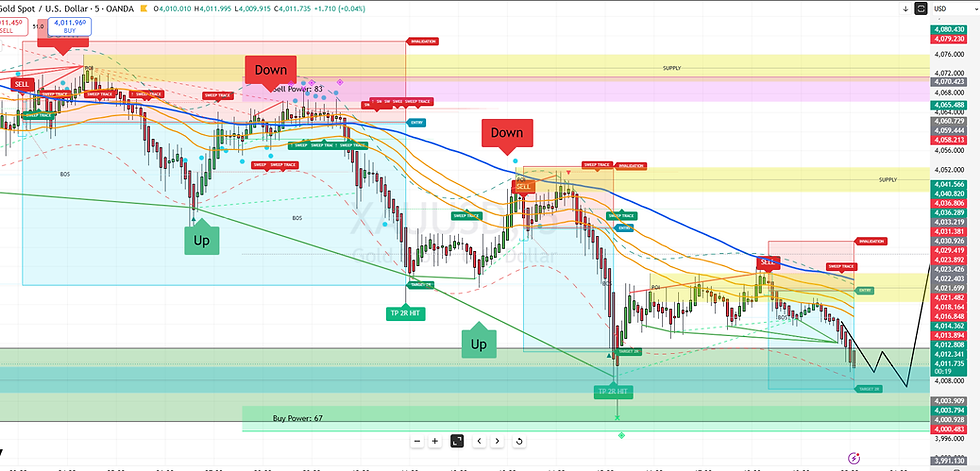
QUANTFLOW DYNAMICS SOFTWARE ANALYSIS DXY
DXY (U.S. Dollar Index) – 4H Technical Analysis
From the chart you've shared, DXY appears to be in a strong bullish market structure despite the current short-term pullback.
1. Market Structure
Higher Timeframe Bias: Bullish
Key observations:
Price has been making higher highs and higher lows since the late-May bottom around 98.70–98.80.
Multiple BOS (Break of Structure) labels confirm bullish continuation.
The recent explosive move from roughly 99.50 → 100.90+ is an impulsive expansion leg.
Price is trading above:
20 EMA
50 EMA
200 EMA (blue)
This confirms bullish trend alignment.
Bias: Bullish until major support is lost.
2. Current Situation
The latest candles show:
Strong rally into supply.
Rejection from the purple supply zone.
Small bearish retracement after liquidity sweep.
This is normal after such an aggressive move.
The market is likely:
Taking profits.
Rebalancing inefficiencies.
Looking for demand before another push higher.
3. Supply Zone Analysis
Major Supply
Purple zone:
101.00 – 101.22
Chart notes:
Sell Power = 68
Previous reaction area
Current rejection originates here
This zone is acting as the nearest resistance.
If Bulls Break Supply
A clean 4H close above:
101.22
would likely target:
101.50
101.80
102.00+
which aligns with the projected bullish path drawn on the chart.
4. Demand Zones
I see three notable demand areas.
Demand Zone 1 (Most Important)
Green structure box:
99.40 – 100.10
This is the immediate bullish retracement zone.
Why important:
Previous consolidation.
EMA cluster support.
Origin of breakout.
Fair value area.
A pullback into this region would be healthy.
Demand Zone 2
Blue zone:
99.15 – 99.35
This is a stronger institutional demand area.
If price drops here:
Bulls likely defend aggressively.
Good area for continuation longs.
Demand Zone 3
Lower blue/green zone:
98.75 – 98.90
This is the last major demand before the structure becomes questionable.
Loss of this zone would significantly weaken the bullish outlook.
5. Liquidity Analysis
Buy-Side Liquidity Taken
Recent move above:
100.60
100.80
100.90
suggests buy-side liquidity has already been swept.
After liquidity grabs, markets often:
Retrace
Fill imbalance
Continue trend
That's exactly what appears to be happening.
6. EMA Structure
The moving averages are stacked bullishly:
Fast EMA above medium EMA.
Medium EMA above slow EMA.
Price above all averages.
This is one of the strongest trend-confirmation signals.
Unless price closes below the EMA cluster, trend remains bullish.
7. Bollinger Band Analysis
Price recently expanded outside the upper band.
That usually means:
Momentum is very strong.
Short-term overextension.
Probability of mean reversion increases.
Current pullback is therefore healthy rather than bearish.
8. Bullish Scenario (Higher Probability)
Expected Path
Pullback into:
100.20–100.00
Possibly 99.80
Buyers step in.
Retest:
100.90
101.20
Break supply.
Continue toward:
101.50
101.80
102.00
This aligns closely with the bullish projection drawn on the chart.
Probability
≈ 65–70%
9. Bearish Scenario
If price fails to hold:
99.90–100.00
then a deeper retracement becomes likely.
Targets:
99.60
99.30 demand
98.90 demand
Only below:
98.75
would I consider the broader bullish structure damaged.
Probability
≈ 30–35%
10. Smart Money Perspective
The sequence looks like:
Accumulation around 98.70–99.00.
BOS upward.
Expansion move.
Liquidity sweep above highs.
Retracement into demand.
Continuation.
This is a classic bullish continuation model.
Trading Levels to Watch
Level | Importance |
101.22 | Major resistance |
101.00 | Supply entry zone |
100.50 | Near-term support |
100.00 | Key psychological support |
99.40–99.30 | Strong demand |
98.80 | Structure invalidation zone |
Overall Conclusion
Trend: BullishShort-Term: Corrective pullbackMedium-Term: Bullish continuation favoredKey Demand: 99.40–100.00Key Resistance: 101.00–101.22
The chart currently looks more like a bullish pullback after a liquidity sweep rather than the beginning of a larger bearish reversal. As long as DXY remains above the 99.30–99.40 demand area, buyers retain control and a move toward 101.20–102.00 remains the higher-probability outcome.
Comments