
Copy of #Gold chart is a textbook Quantflow Dynamics setup, here's the analysis


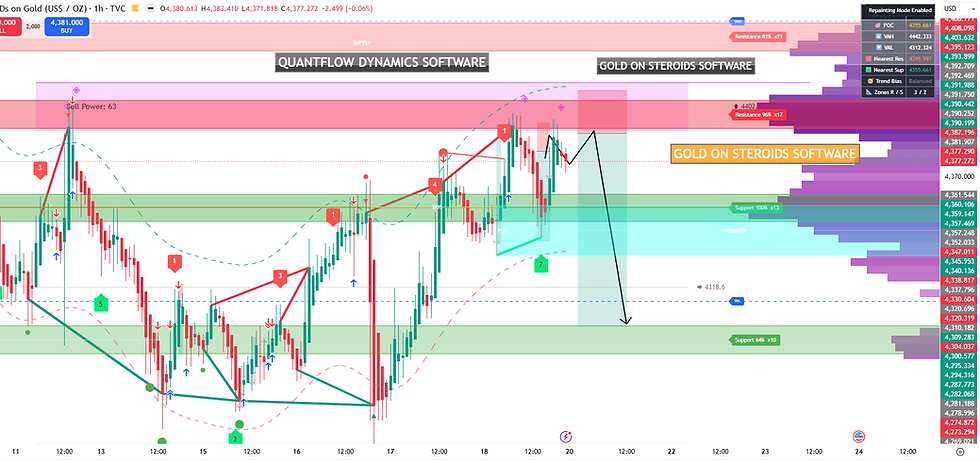
Gold chart is a textbook Quantflow Dynamics setup: a clean supply‑driven SELL opportunity, followed by a potential deep BUY zone if price sweeps lower. Your chart shows divergence, supply activation, Fibonacci alignment, and clear invalidation levels — making this one of the easiest Quantflow reads today.
I’ll break it down simply and precisely.
🟥 1. Current Bias: Bearish (short‑term)
Your chart shows:
Bear Div at the top
A clean SUPPLY zone
Trend Magic turning bearish
SELL signals already printed
Fibonacci retracement aligning with supply
Weak Buy Power (62 → not enough to break supply)
This means Gold is more likely to move down first.
🟦 2. SELL Zone (High‑Probability)
SELL: 4055 – 4062
This zone contains:
Supply
Bearish divergence origin
Trend Magic resistance
Fibonacci 0.382 – 0.236 cluster
Previous rejection
This is the strongest SELL zone on the chart.
Best confirmation: A bearish rejection candle inside supply → long upper wick → close below Trend Magic.
🛑 3. SELL Invalidation
INVALIDATION: 4068
If price closes above 4068, supply is broken and the SELL setup is invalid.
🎯 4. SELL Targets (Quantflow Dynamics)
TP1: 4044
Fibonacci 0.618 + minor demand.
TP2: 4037
Fibonacci 0.786 + deeper liquidity.
TP3: 4027
Your chart’s projected 2R target.
🟩 5. BUY Zone (Only after sweep)
BUY: 4028 – 4022
This zone is where:
Demand sits
Liquidity is resting
Trend Magic may flip bullish
Buy Power typically activates
Institutional orders often cluster
This is the high‑probability BUY zone, but only if price sweeps into it.
🛑 6. BUY Invalidation
INVALIDATION: 4018
If price closes below 4018, demand fails and deeper downside opens.
🟧 7. Next Likely Move (Simple version)
Gold is likely to reject from supply → drop into 4044 → 4037 → 4027 → then bounce from demand.
So the next move is:
➡️ 4055 → 4044 → 4037 → 4027 → 4028–4022 BUY zone
🟫 8. Summary (super simple)
Bias: Bearish first, bullish later
SELL zone: 4055–4062
SELL invalidation: 4068
SELL targets: 4044 → 4037 → 4027
BUY zone: 4028–4022
BUY invalidation: 4018
This is a clean Quantflow Dynamics setup with perfect structure.


Comments